Rules
Part of Primary market research: the version that survives contact with reality
Getting primary market research benchmarks right the first time (2027 update)
Benchmarks for primary market research should reflect decision quality, sample frames, and data fitness, not just response rates, so teams get them right initially.
What to take away
- A response rate is a survey outcome rate, not proof that nonresponse error is small. Save the disposition codes and the exact formula behind every rate you publish.
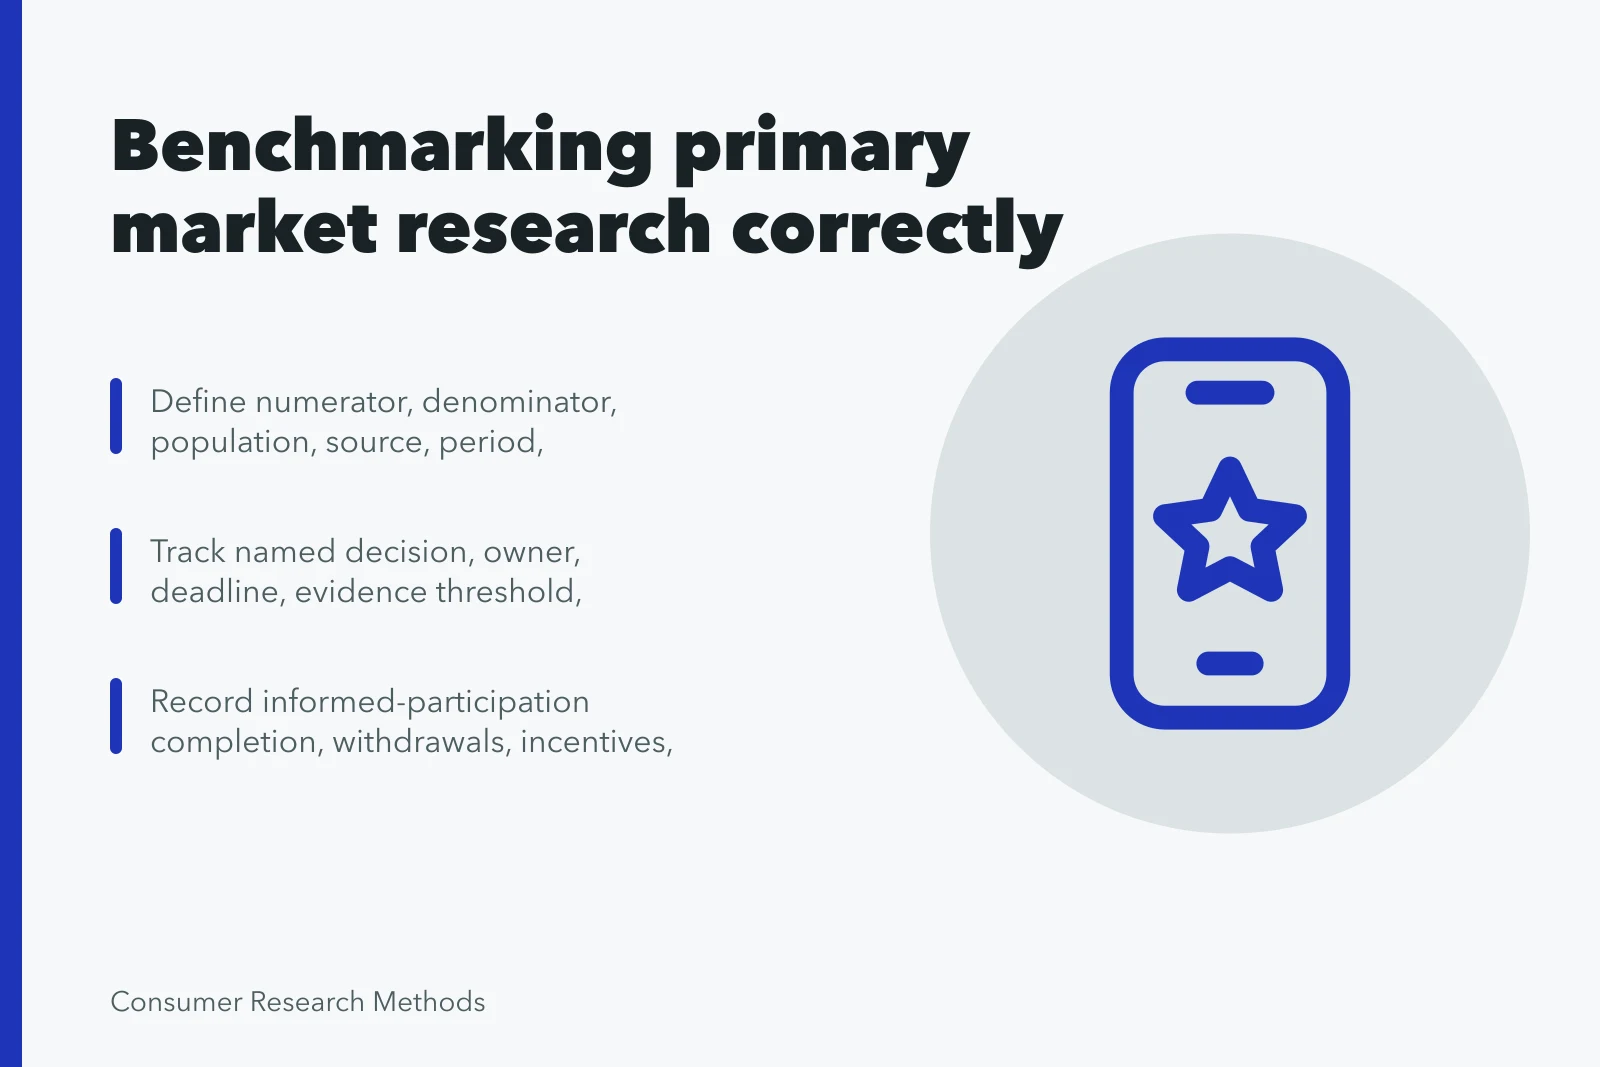
- Define each benchmark with its numerator, denominator, population, period and exclusions before you field, not after the numbers look weak.
- Judge research data on fitness for purposecompleteness, uniqueness, consistency, timeliness, validity and accuracy, each set against the decision it serves.
- Report raw counts beside every rate. A 100% pass on four records is not a quality system.
- Pair each measure with an owner and a threshold that triggers a named action.
Primary market research benchmarks fail in a predictable way: they measure activity instead of fitness. A study can hit its quota, close on time and still be unusable if the frame missed the people the decision concerns.
Start with the disposition codes
AAPOR's Standard Definitions resource sets out final disposition codes and the outcome rates built from them, including response, cooperation, refusal and contact rates. It states plainly that response rate alone does not establish nonresponse error. A high rate with a frame that never reached the right households still leaves the estimate biased.
So publish the codes. Record every sampled unit as complete, partial, refusal, or non-contact. Also record ineligible or unknown eligibility. Keep the denominator visible. Then assess coverage, selection, measurement and decision fitness as separate questions. Coverage gaps usually start before fieldwork, in the same primary market research mistakes that skew a sample at recruitment.
Judge data on fitness, not volume
The U.K. government's Data Quality Framework treats quality as fitness for purpose across a data lifecycle and names six dimensions: completeness, uniqueness, consistency, timeliness, validity and accuracy. It is public-sector guidance, so adapt the dimensions to your own data and set thresholds from your own risk.
Judge data on fitness
| Dimension | What it asks of a study | Local check |
|---|---|---|
| Completeness | Are required fields and cases present? | Item nonresponse by subgroup |
| Uniqueness | Is each respondent counted once? | Duplicate and panel-overlap audit |
| Consistency | Do values agree across sources and waves? | Same question, same coding, same period |
| Timeliness | Did data arrive before the decision? | Fielding end date against decision date |
| Validity | Does the measure capture the concept? | Pilot against a known group |
| Accuracy | Is the recorded value correct? | Re-contact a sample of records |
Instrument and field quality
Track pilot defects and corrected defects. Track version deviations. Track ineligible and duplicate records. Track missing data and translation problems. Track fraudulent responses and justified exclusions. Keep raw counts beside rates. A team that cancels a bad fielding wave and reports it is healthier than one whose dashboard shows only completed interviews.
Analysis quality follows the same logic. Review codebook completion, reproducible transformations, independent checks, weighting diagnostics, uncertainty reporting and corrections issued. Where traceable decisions carry the analysis, a market research strategy checklist stops the steps from being skipped.
Worked example: a benchmark card
A card makes a measure checkable by someone who did not run the study. Fill in each field before fielding.
- Name the measure and the decision it informs.
- Write the formula, numerator and denominator.
- State the population, frame, period and exclusions.
- Name the owner and the action threshold.
- Record the result, the limitations and the review date.
A card reading "decision coverage: 6 of 9 consequential studies had evidence before the deadline; owner: research lead; threshold: below 8 triggers a scoping review" can be audited. "Improved research quality" cannot.
Keep the comparison honest
The GAO evaluation design guide links evaluation questions to evidence needs and design choices. Apply that discipline to primary market research benchmarks; federal evaluation guidance does not make a local marketing result causal or transferable.
The NIST experimental design selection guidance starts design choice with the objective and the practical constraints. Use it to separate benchmark reporting from controlled effect estimates. Observation is not causation, however tidy the table.
Common questions
What makes a primary research benchmark usable?
It is stable across waves, tied to a named decision, defined by an exact formula, and paired with a threshold that triggers action. If two analysts compute it differently, it is not yet a benchmark.
Should industry averages set the target?
Rarely. Populations, frames, modes, definitions and decision risks differ enough that a published average from another sector often says nothing about your study. Set the target from your own baseline and the cost of being wrong.
How often should benchmarks change?
Review after a material change to the decision, the population, the method, the supplier or the cost of error. A benchmark that survives a redesign unchanged is measuring the old study.
Does a high response rate mean the data are good?
No. AAPOR's guidance is explicit that response rate alone does not establish nonresponse error. Check the frame, the disposition codes and whether nonrespondents differ from respondents on the measure you care about.