Guides
Using Census Population, Age and Migration Tables to Choose Research Markets
Census population, age and migration tables set the sample frame for US consumer research, from the first cost estimate to the day the market list is signed off.
What to take away
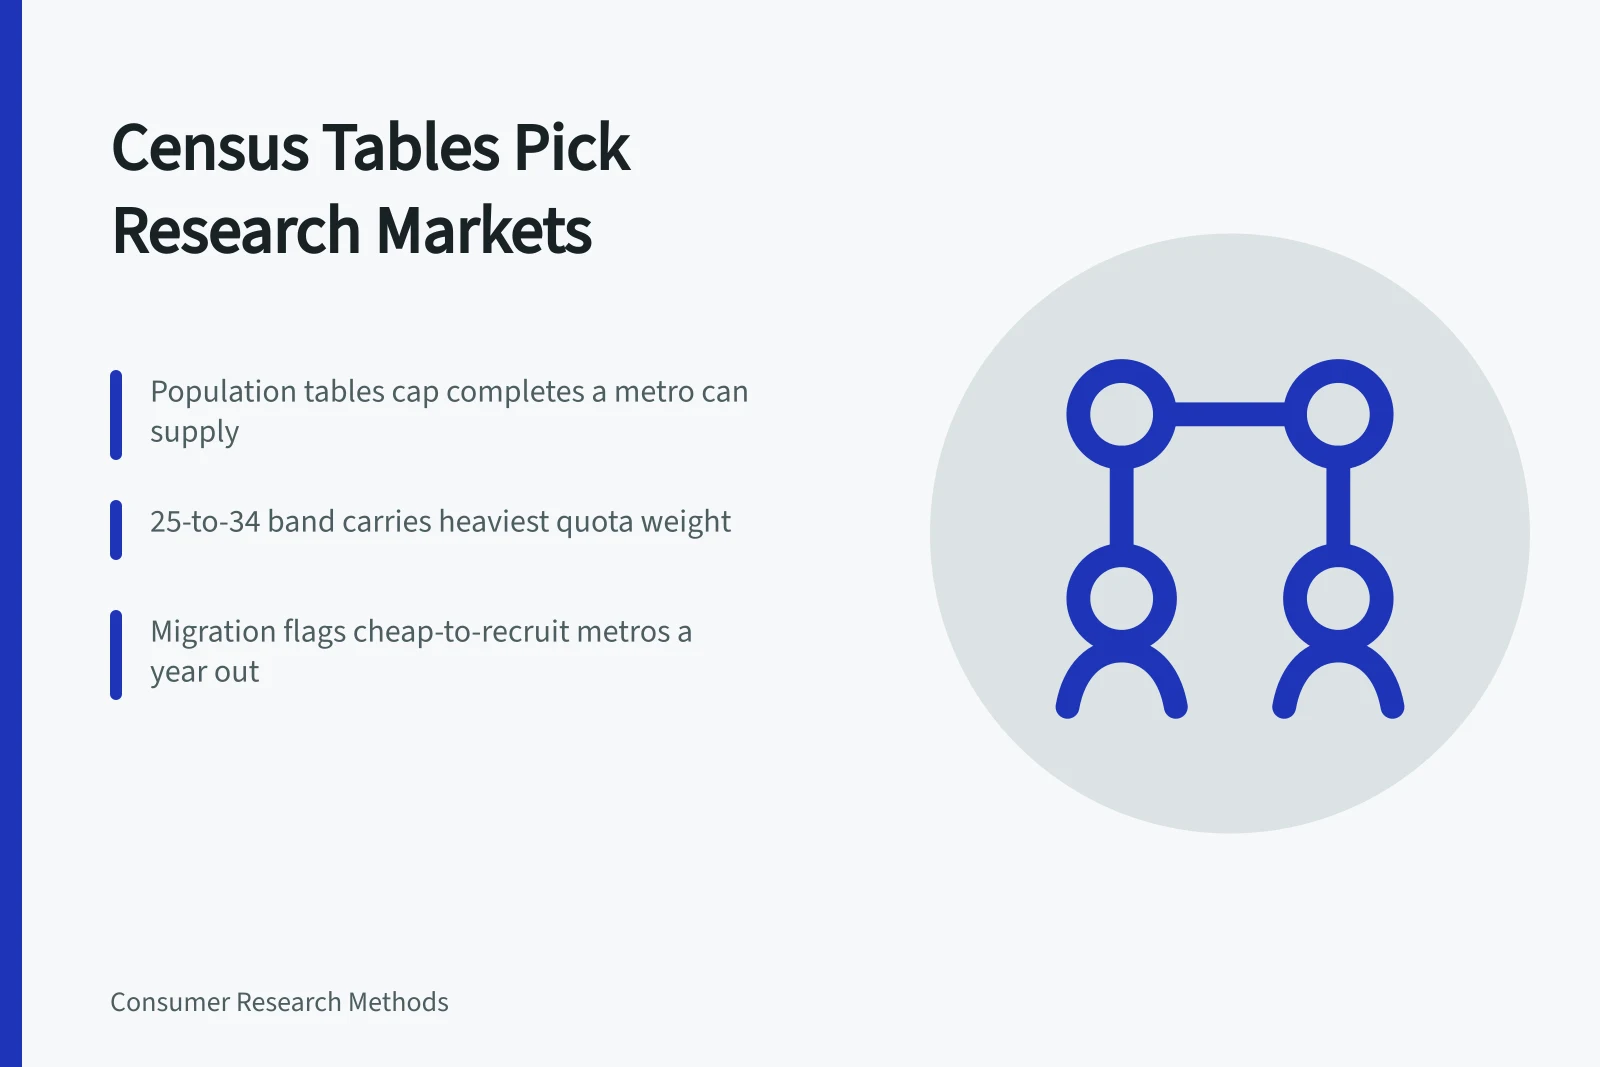
- Census population tables set the ceiling on how many completes one market can supply.
- Age distribution predicts quota fill rates, and younger metros recruit at lower incentives.
- Migration tables flag growing metros a year before population counts move.
- The tables work in sequencepopulation filters, age ranks, migration sets timing.
- Census data stops being useful once the study needs attitudes or intent.
Why Census tables beat city-by-city guessing
Research plans often follow the client's real estate. A recruiter lives in Los Angeles, so Los Angeles gets the intercepts.
The U.S. Census Bureau publishes population, age and migration tables for every metropolitan statistical area. Teams that want employment and wage context alongside those counts can turn to this guide to using U.S. Census Bureau and BLS data for secondary market research.
None of those measures mentions a brand, a category or an attitude. Three tables settle most of the geography question before a screener is written.
Metro population tables set the ceiling on any sample
Population is the bluntest measure and the one to apply first. It caps the number of completes a market can deliver inside a fielding window.

A metro of several million residents outproduces one of several hundred thousand at similar incidence. Incidence, not population, decides the cost per complete.
| Metro | Region | Why it matters for a recruiting plan |
|---|---|---|
| New York | Northeast | Deepest pool, widest range of language quotas |
| Los Angeles | West | Large Spanish-language pool, dense media workforce |
| Chicago | Midwest | Third largest metro, the Midwest anchor |
| Dallas-Fort Worth | South | Fast growth, lower costs than the coasts |
| Atlanta | South | Young population, strong in-migration |
New York holds the largest pool for nearly every category and the highest cost per interview. Population ranks capacity, not willingness, so filter with it first. Saturation matters too, since the biggest metros carry the most competing research vendors.
Teams that need Southern quota coverage should read these notes on recruiting representative samples in Atlanta, Miami and Dallas before they book a facility.
Age distribution predicts which metros fill quotas
Age predicts cooperation. Consumer panels draw most completes from adults under 45, and the 25-to-34 band carries the heaviest weight in most quota designs.
The Census splits population into five-year bands. Three of them do most of the work.
- 18to 24: cheap to reach online, weak on spending questions.
- 25to 34: the core band for concept and package tests.
- 35to 44: a smaller share, stronger on diary studies.
Sort the metros that passed your population filter by the 18-to-34 share. Markets high on both measures get full quota coverage.
Migration flows flag markets before they mature
Migration is the fastest-moving table and the most useful for timing. Population counts shift slowly, and migration can swing inside one year.
Domestic moves follow jobs, housing and climate. International moves concentrate in gateway metros and change language requirements for the questionnaire.
For a study planned a year out, migration flags the markets that will stay cheap to recruit. Regional buying habits travel with those arrivals. This comparison of regional consumer differences across the South, Midwest and Northeast explains why one national script often underperforms.
Example: screening Phoenix against five other metros
A team needs 1,200 completes across six metros. The client insists on Phoenix. Census tables put Phoenix above the national median on population growth and below it on median age.
Pull three figures: the population estimate, the American Community Survey age bands, and current migration estimates.
Sample size, not metro count, drives the budget. The formulas behind that choice, including confidence level and margin of error, sit in this explanation of sample size determination.
A five-step method from first estimate to final list
- Fix the sample size and the number of metros the budget can carry.
- Pull population estimates for every candidate metro and drop those below your threshold.
- Rank the survivors by the share of adults aged 25 to 34.
- Overlay net migration for the past 12 months and flag metros moving against their neighbors.
- Check panel coverage, facility availability and incentive costs in each finalist.
Cost per complete drives step five. This comparison of consumer research costs in New York, Chicago and Austin shows how far apart field rates run. The BLS Handbook of Methods documents how a federal agency records its own field costs.

Panel supply decides whether the plan survives the field. An overview of online panels covers how recruitment and composition shape what a buyer can quota.
Where Census data stops being enough
Census tables answer who lives somewhere. They cannot say what those residents buy, believe or intend. That gap is where attitudinal research starts.
Two limits matter. The tables lag real change, and they are not segmented by your category.
Once the market list is set and fieldwork is booked, the Census work is done. It stops needing attention there.
Common questions
Does a larger metro always mean a cheaper sample?
No. Big metros cost more per interview because incentives and facility rates run higher. Population sets the ceiling, not the price.
When should migration data change the market list?
When a metro's net inflow swings sharply against its neighbors over 12 months. That signal is worth acting on before population estimates catch up.
What happens to the market list after fieldwork is booked?
It becomes a study design question. These nine details of market research strategy development cover the choices that follow.