Reviews
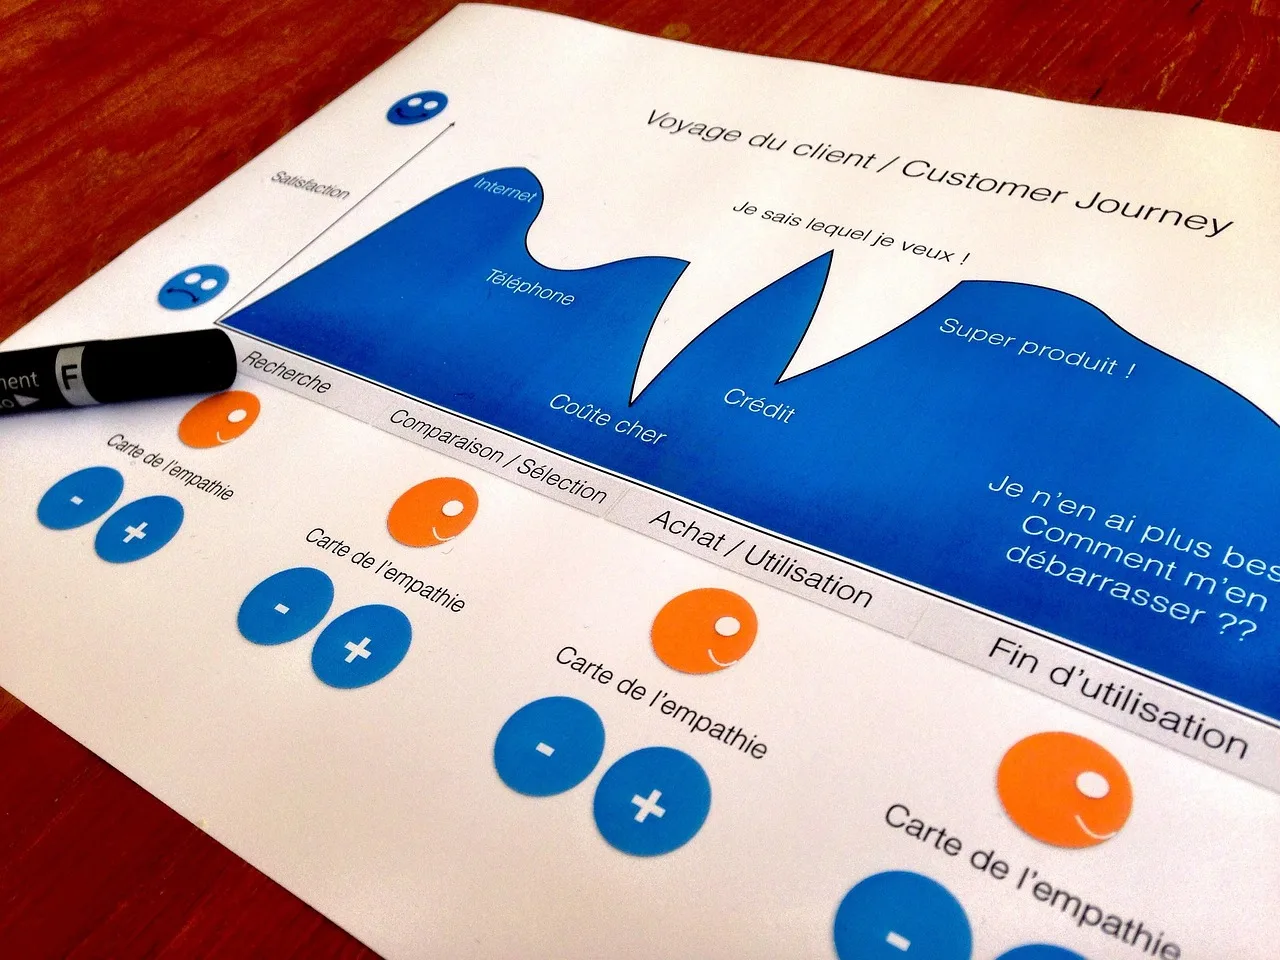
Part of Customer research: how journey maps expose backstage constraints
What the customer research examples actually show
Customer research examples for 2027 cover journeys, switching, accessibility, pricing, onboarding, support, cancellation, lost sales, and market entry.
What to take away
- Each example is a planning pattern, not a guaranteed recipe.
- Combine methods only when behavior, explanation, prevalence, accessibility, and change over time require different evidence.
- Every example needs a customer decision, inclusion plan, safe participation, pilot, traceable analysis, limits, and action owner.
Customer research examples are useful when they connect a decision with a suitable method. The nine sections below pair each decision with a method, a typical sample, and a claim limit. Adapt the population, safeguards, sample, analysis, and evidence threshold to the decision and customer risk.
Named public examples include Nielsen Norman Group's journey mapping guidance, Baymard Institute's checkout usability research, and GOV.UK's user research guidance. Common tools include Dovetail, Optimal Workshop, Maze, Qualtrics, and UserTesting. They show the same decision-first pattern: choose the method for the decision and state the claim limit. Sample sizes below are typical planning ranges, not published company figures.
Public examples show concrete findings. Baymard Institute's checkout usability research reports an average checkout flow of 11.8 form fields and that 26% of users cite required account creation as a reason to abandon. Nielsen Norman Group's usability testing research found that 5 users typically uncover about 85% of usability problems.
GOV.UK's user research guidance recommends testing with at least 5 users per round and repeating rounds as the service changes. Treat these as public findings and typical planning references, not guarantees.
1. Map a recent journey
Interview and observe people through one completed task. Capture goals, steps, handoffs, delays, evidence, workarounds, failures, channels, and backstage causes. Include people who did not finish. Typical samples run 8 to 12 participants per task and segment. Ask for a receipt or confirmation email.
Journey mapping evidence
- Interview and observe one completed task
- Capture goals, steps, handoffs, delays
- Record evidence, workarounds, failures, channels
- Note backstage causes
- Include people who did not finish
2. Study switching decisions
Recruit recent joiners and leavers. Reconstruct trigger, alternatives, evaluation, risk, effort, timing, decision roles, and aftermath using concrete artifacts where authorized. Do not turn the invitation into win-back sales. Typical samples run 10 to 15 recent switchers. Ask, 'What did you check first?'
Worked example. Decision: add a low-cost plan tier. Sample: 10 to 12 recent switchers. Script: 'What did you check first when you compared plans?' Finding: price came first, then fees and contract length. Action: add a fee summary to the comparison page and review after 30 days.
Typical timeline: 2 to 4 weeks. Cost depends on recruitment, incentives, and analysis time.
3. Audit accessibility barriers
W3C's guidance on involving users in web projects recommends involving people with varied disabilities early and throughout development, using real contexts and combining user input with accessibility standards. It also warns against treating one person's experience as representative of everyone with that disability.
Work with disabled participants using their usual technology and context. Test information, tasks, support, payment, and follow-up. Provide accommodations and avoid treating one participant as representative of a disability. Typical audits recruit 5 to 8 disabled participants. Ask, 'Show me how you do this with your usual setup.'
4. Understand price interpretation
Study what customers believe is included, how they compare options, which fees surprise them, and how price interacts with trust and access. Separate stated willingness from observed purchase behavior. Stated willingness and observed purchase behavior are exactly the split that primary market research examples lay out decision by decision.
Typical studies run 12 to 20 interviews. Ask, 'What do you think is included in that price?'
5. Diagnose onboarding failure
The Census Bureau's questionnaire testing and evaluation appendix documents cognitive interviews, usability testing, respondent debriefing, behavior coding, and field techniques for federal surveys. A product team can borrow the pretesting logic without claiming that the appendix validates its onboarding study or sample.
Combine funnel events with observed sessions and follow-up interviews. Check instrumentation, eligibility, comprehension, identity steps, device, bandwidth, handoffs, and emotional risk before blaming motivation. Typical reviews pair 5 to 10 observed sessions with funnel data. Ask, 'Where did you pause during sign-up?'
6. Examine support demand
Sample support records by issue and customer group, then interview customers and frontline staff. Separate contact avoided, contact resolved, repeat contact, and silent abandonment. Protect sensitive account information. Typical studies sample 100 to 300 tickets. Ask, 'What did you try before you contacted us?'
7. Learn from cancellation
Recruit recent leavers independently of sales. Explore changing needs, value, service failure, alternatives, timing, and cancellation experience. Compare reasons with authorized product and billing evidence. Typical studies recruit 10 to 15 recent leavers. Ask, 'What changed between sign-up and cancellation?'
8. Review lost sales
Study buyers who chose a rival, substitute, workaround, or no action. Include decision roles and procurement constraints. Keep participation voluntary and separate from an active sales pursuit. Typical studies interview 8 to 12 buyers. Ask, 'Who else was involved in the decision?'
9. Explore a new market
Begin with secondary evidence, then interview relevant users, buyers, administrators, and excluded groups locally. Test language, workflow, regulation, trust, access, and alternatives before estimating demand. Typical studies start with 5 to 10 local expert interviews. Ask, 'How do you solve this problem today?'
Every idea needs a decision charter, inclusion plan, informed participation, minimal data, neutral guide, pilot, traceable analysis, stated limits, and action owner. The result should show what changed and what remains uncertain, not merely produce vivid quotations.
Example-to-evidence map
| Decision | Primary evidence | Claim limit |
|---|---|---|
| Journey map | Completed task walkthrough and artifacts | Recalled steps only |
| Switching | Recent event reconstruction | Recalled contexts only |
| Accessibility | Use in normal technology context | Covered participants only |
| Price | Interviews plus purchase records | Stated and observed split |
| Onboarding | Events, observation, interview | Instrumented paths only |
| Support demand | Sampled tickets plus interviews | Logged contacts only |
| Cancellation | Recent leavers plus billing evidence | Authorized records only |
| Lost sales | Buyer interviews plus decision roles | Voluntary recall only |
| New market | Secondary and local direct research | No automatic demand estimate |
Turn examples into test cases
The NIST Privacy Framework starting guide outlines a voluntary process for identifying and managing privacy risk. Use it to assign data and response owners for customer research examples; it is not legal clearance.
The W3C information and relationships explanation says visual structure and relationships should also be programmatically available. Apply that check to customer research examples outputs, then test the actual page with the users and technology in scope. Testing outputs with real users also reveals customer research mistakes like treating one participant as representative.
Common questions
Are these real company examples?
No. It names public method examples from Nielsen Norman Group, Baymard Institute, and GOV.UK, but it uses no confidential company cases. It sets out decisions and evidence limits instead.
Why study customers who left?
Former customers can reveal changing needs, service failures, alternatives, and exit barriers hidden from active-user samples.
Can one disabled participant represent accessibility?
No. Recruit relevant variation in functional needs, technologies, experience, contexts, and product use and combine findings with standards.